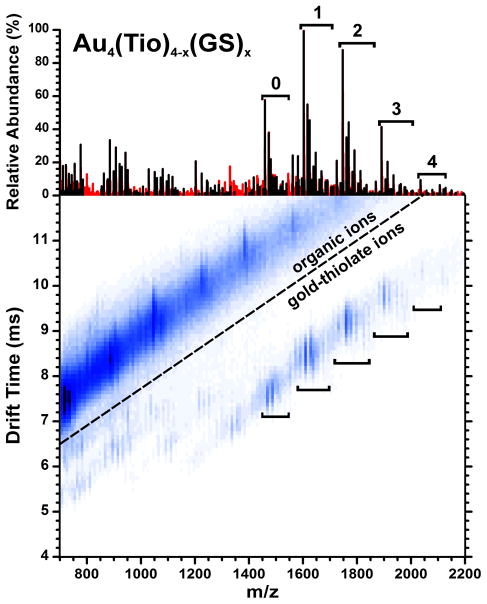
Figure 2.
Ion mobility-mass spectrum of 56:44 Tio:GS AuNPs, and a mass spectrum showing the peaks from the extracted gold-containing region (above). Black peaks represent ions which were used for the quantitative calculations, red peaks were disregarded. The Au4L4 ions with different numbers of tiopronin and glutathione (x) are indicated by brackets.

