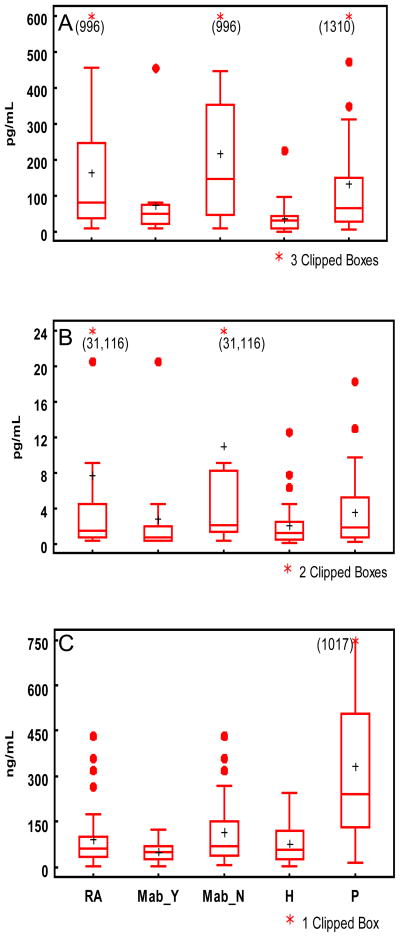
Figure 1.
Box plots of salivary biomarker levels A) IL-1β, B) TNF-α, C) MMP-8 in the 3 study groups. Horizontal lines represent the 25th, 50th and 75th percentiles, plus sign represents the mean, and asterisks represent outliers. RA denotes rheumatoid arthritis group. Mab_Y denotes RA patients on monoclonal anti-TNF-α antibody therapy. Mab_N denotes RA patients not receiving monoclonal anti-TNF-α antibody therapy. H denotes healthy group. P denotes periodontal disease group.

