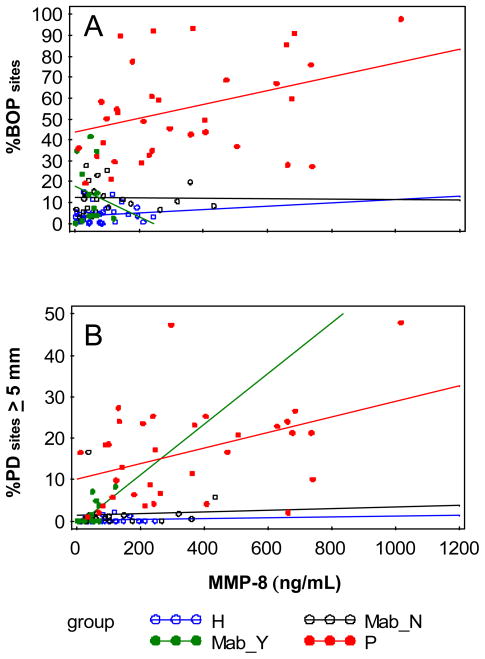
Figure 2.
Scattergram and least squares line between A) MMP-8 level and %BOP, and B) MMP-8 level and %PD sites ≥5 mm by group. Group H denotes healthy, Mab_Y denotes RAon anti-TNF-α therapy, Mab_N denotes RA not on anti-TNF-α therapy, and P denotes periodontitis. In A) the slopes for the Mab_Y and P group were significant (r=0.63, P=0.02; r=0.42, P=0.01, respectively), and in B) only the slope for the P group was significant (r=0.36, P=0.04).

