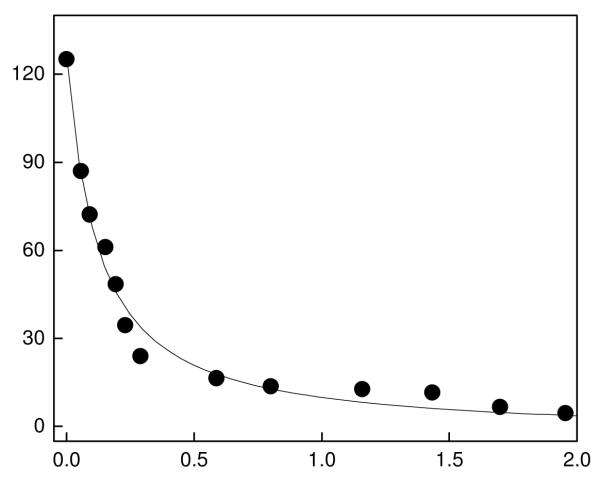
Figure 2.
Binding isotherm for the interaction of c-SAHA with HDAC8. The decrease in fluorescence emission intensity at 400 nm (λex = 325 nm) for the titration of 100 nM c-SAHA with increasing concentration of HDAC8 (total) is shown. The solid smooth line is the best fit of the experimental data Qin and Srivastava [29] for the Kd value of 0.16 ± 0.02 μM.

