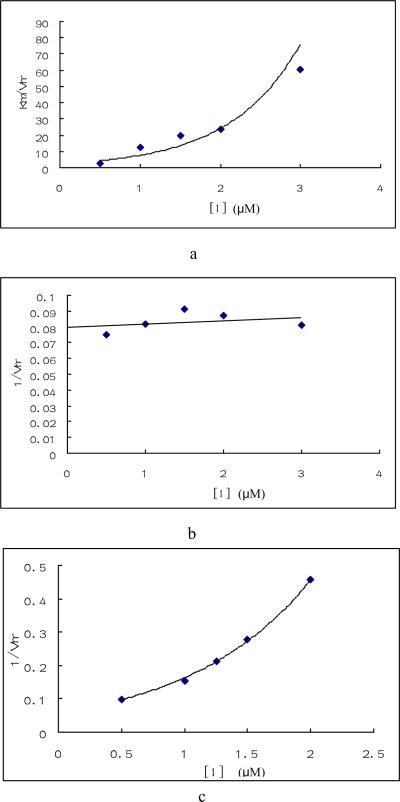
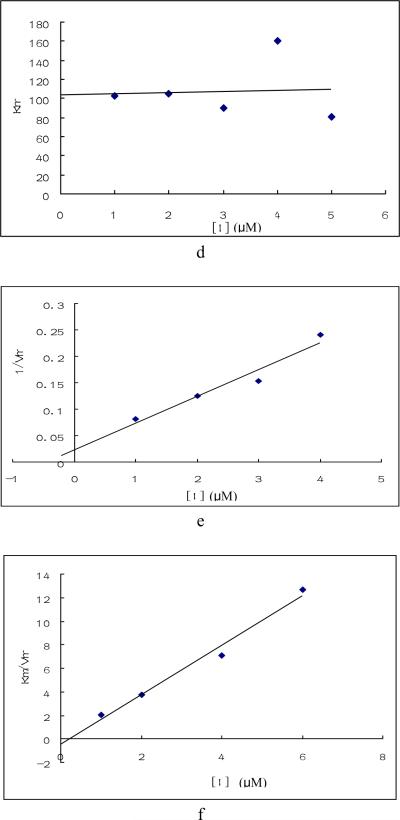
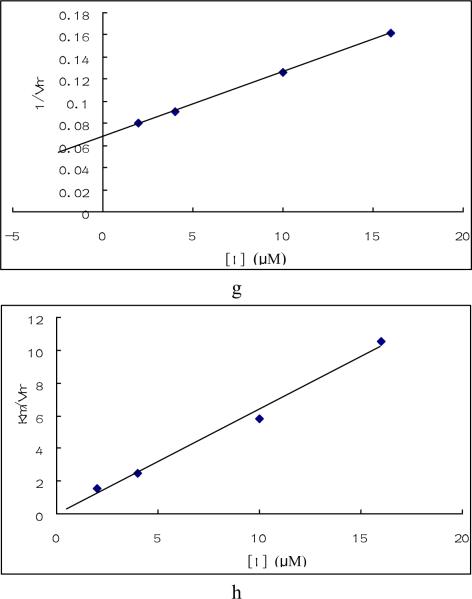
Fig. 3. Enzymatic study of compounds.
Enzyme inhibition by compound 1, 4 and 24 were tested under saturated galactose and varied ATP concentration (a, b, e, f, g, h) or saturated ATP and varied galactose concentration(c, d). Triplicate data were analyzed with Sigma Plot 10.0 software. a. Plots of Km / Vmax vs compound 1 concentration when galactose was saturated and ATP varied. b. Plot of 1/ Vmax vs. compound 1 concentration under the same condition as a. c. Plot of 1/ Vmax vs. compound 1concentration when ATP was saturated and galactose varied. d. Plot of Km vs. compound 1concentration under the same condition as c. e. Plots of 1/ Vmax vs compound 4 concentration under the same condition as a. f. Plot of Km / Vmax vs. compound 4 concentration under the same condition as a. g. Plot of 1/ Vmax vs compound 24 concentration under the same condition as a. h. Plot of Km / Vmax vs. compound 24 concentration under the same condition as a.


