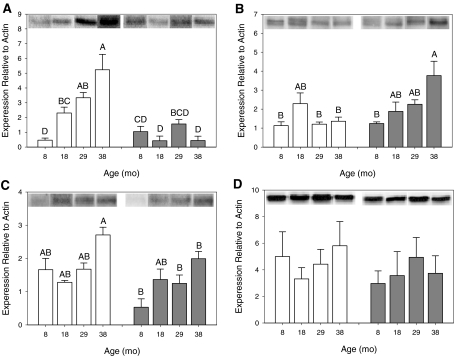
Fig. 1.
Effect of age and diet on CSE and CBS protein expression. CSE expression is shown in aorta (a, n = 3–5 per group) and liver (b, n = 3 per group). CBS expression is shown in aorta (c, n = 3–4 per group) and liver (d, n = 3 per group). The y-axis shows CSE (a and b) or CBS (c and d) protein expression relative to β-actin. The x-axis shows the age in months (mo). AL data are in white columns and CR data are in grey columns. Representative blots are aligned along the top, above each column. Data are represented as mean ± SE and were analyzed by 2-way ANOVA with Tukey's post-hoc tests. Means that do not share a common letter are significantly different

