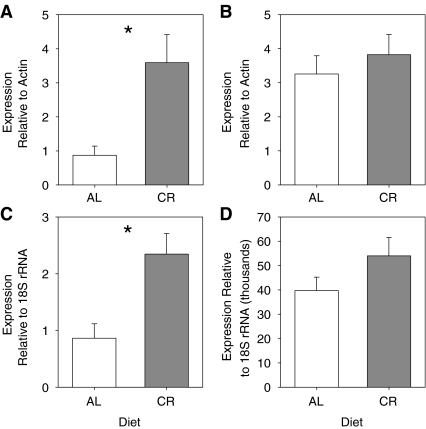
Fig. 2.
Effect of diet on CSE and CBS mRNA expression. CSE expression is shown in aorta (a, n = 13 AL, n = 12 CR) and liver (b, n = 12 per group). CBS expression is shown in aorta (c, n = 12 AL, n = 11 CR) and liver (d, n = 12 per group). The y-axis shows CSE (a and b) protein expression relative to β-actin and CBS (c and d) protein expression relative to 18S rRNA. The x-axis shows the diet. AL data are in white columns and CR data are in grey columns. Data are represented as mean ± SE and were analyzed by one-tailed or pooled t tests. Means that are significantly different are indicated by asterisks

