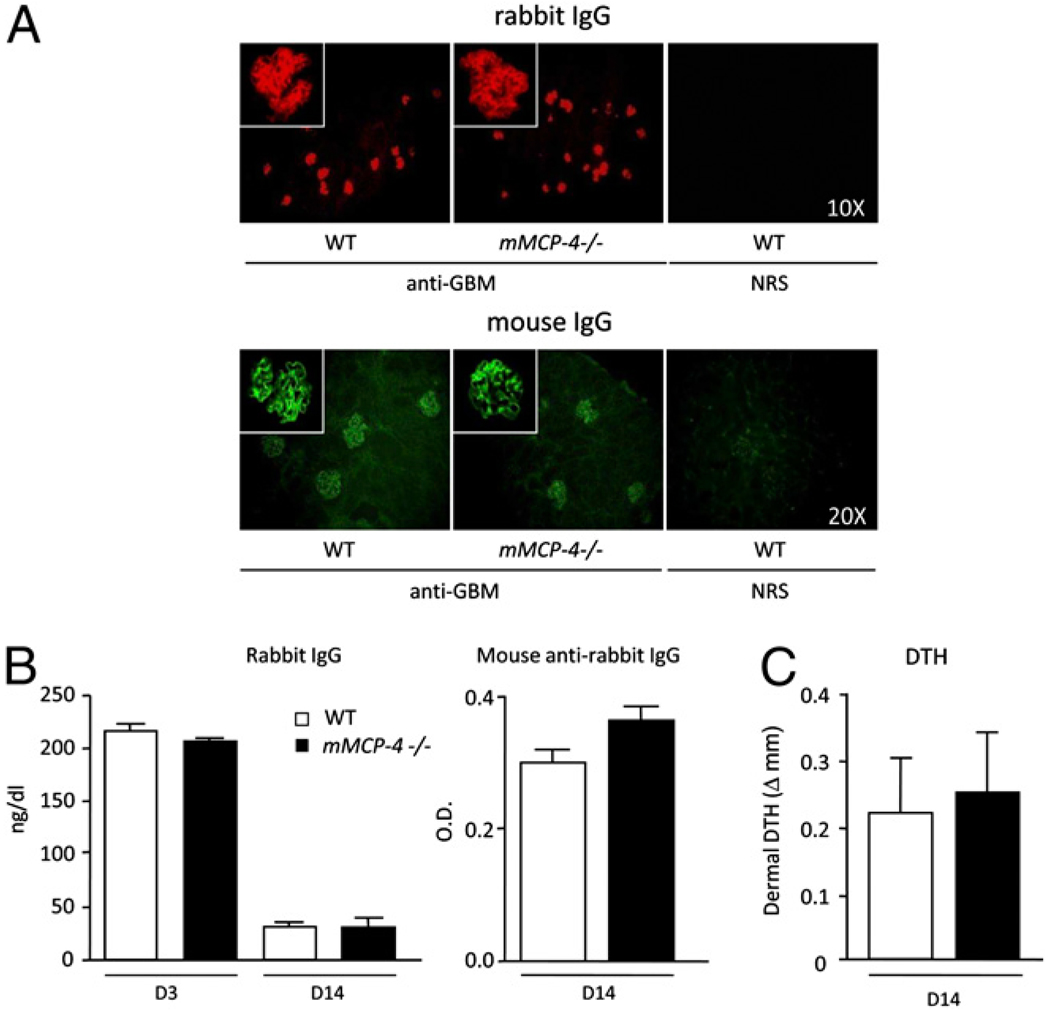
FIGURE 4.
Assessment of immune responses. A, Levels of heterologous anti-GBM rabbit Abs and autologous mouse anti-rabbit IgG in glomeruli. Cryostat kidney sections (day 14) from anti-GBM–treated WT mice (n = 9), mMCP-4−/− mice (n = 13), and healthy NRS-treated WT control mice were stained using Rhodamine goat anti-rabbit IgG (top panels) and FITC goat anti-mouse IgG (bottom panels) Abs and analyzed by immunofluorescence microscopy. Objective magnification is indicated. The inset shows a single glomerulus at higher magnification (63× objective). B, Circulating rabbit and mouse anti-rabbit Abs in sera of mMCP-4−/− and WT mice were measured by ELISA, as described in Materials and Methods. Sera were collected at day 3 (n = 3) and at day 14 (WT mice, n = 9; mMCP4−/−mice, n =13) after the induction of anti-GBM GN. C, Dermal DTH responses to rabbit IgG in WT mice (n =5) and mMCP-4−/− mice (n = 5). The swelling response was determined at day 14 after the induction of anti-GBM GN. All data are mean ± SEM.

