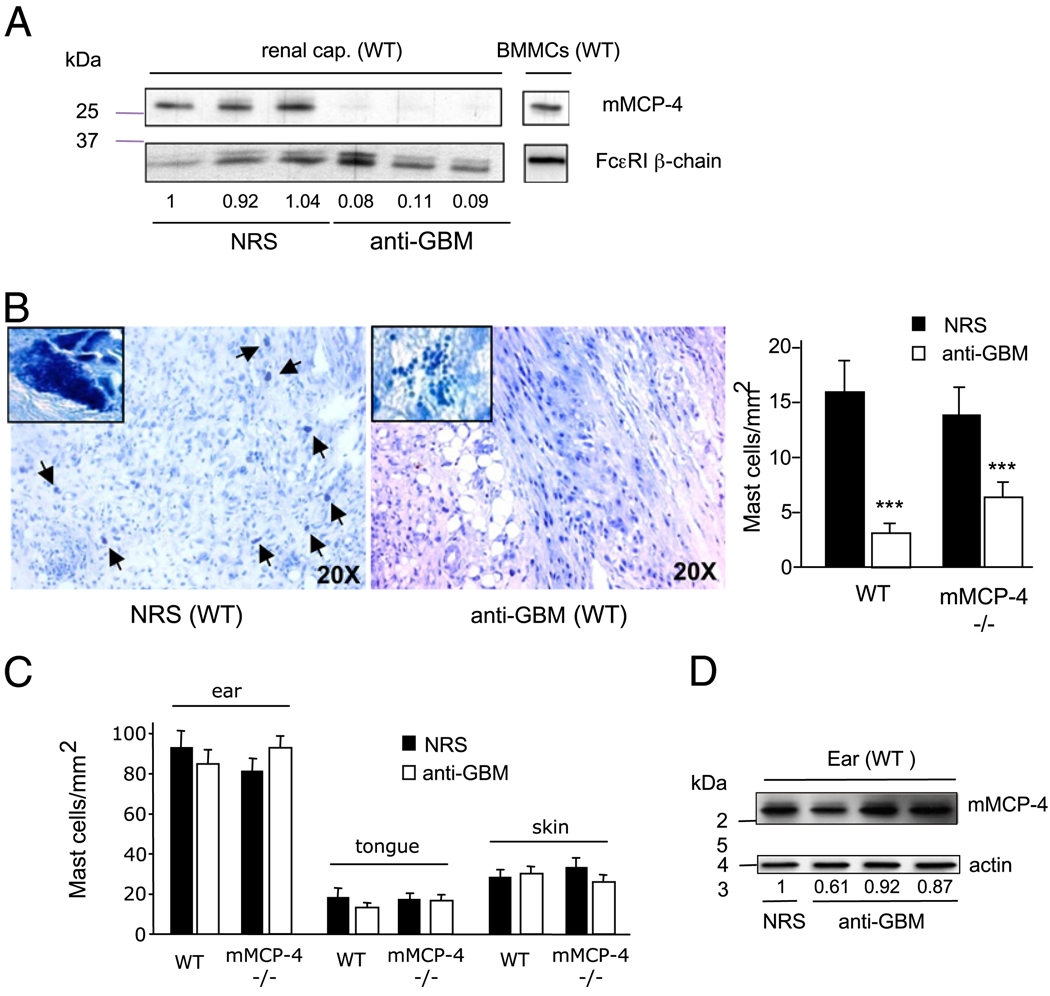
FIGURE 5.
mMCP-4 expression in renal capsules before and after the induction of anti-GBM GN and mast cell quantification. A, Lysates (20 µg/lane) of renal capsule tissue from NRS- and anti-GBM–treated WT mice or an equivalent of 1 × 10⁵ BMMC control lysates were migrated in parallel on 12% SDS-PAGE and analyzed by immunoblotting using anti–mMCP-4 or anti-FcεRI β-chain Abs. Numbers indicate relative expression levels compared with the first lane, which was set arbitrarily to 1. B, Several granulated mast cells stained with toluidine blue (arrows) can be observed in renal capsule tissue from control (NRS)-treated WT mice, whereas they are absent in anti-GBM–treated mice. Objective magnifications are indicated. Insets show high magnification (100× objective) of intact granulated and degranulated mast cells (taken in a different field), the latter being observed often after anti-GBM treatment. Respective quantification of toluidine blue-stained mast cells in healthy NRS-treated mice (n = 6), anti-GBM–treated WT mice (n = 6), and mMCP-4−/−mice (n= 6) is reported in the far right panel. ***p< 0.001. C, Quantification of toluidine blue-stained mast cells in indicated tissues. All data are mean ± SEM. D, Lysates (20 µg/lane) of ear tissue from NRS- and anti-GBM–treated WT mice were migrated in parallel on SDS-PAGE and analyzed by immunoblotting using anti–mMCP-4 or anti–β-actin. Numbers indicate relative expression levels compared with the first lane, which was set arbitrarily to 1.

