
Figure 2.
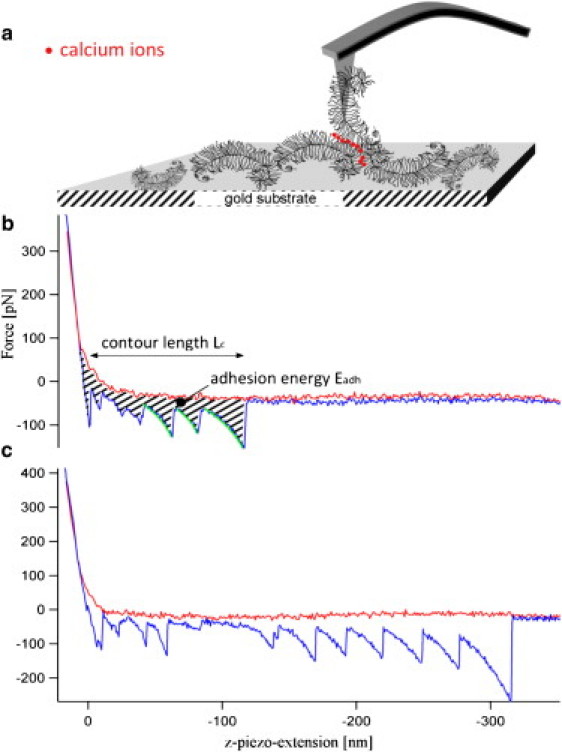
(a) Illustration of calcium-mediated self-adhesion interaction in an AFM-SMFS experiment between aggrecan monomers immobilized on a gold-coated tip and gold substrate surface. (b) Typical force-versus-distance curve of an aggrecan self-adhesion interaction obtained in calcium-containing solution. The red and blue parts of the force-versus-distance curve respectively show the approach and withdrawal of the tip with a sawtooth force pattern. The hatched area represents the adhesion energy Eadh, and the green part of the force-versus-distance curve corresponds to the fit of the respective molecular elasticities. Contour length Lc relates to the distance from surface contact to a force-free cantilever. (c) Another example of a typical force-versus-distance curve, with a longer contour length Lc. This difference is due to the random fixation of aggrecan on the gold surface.