
Figure 2.
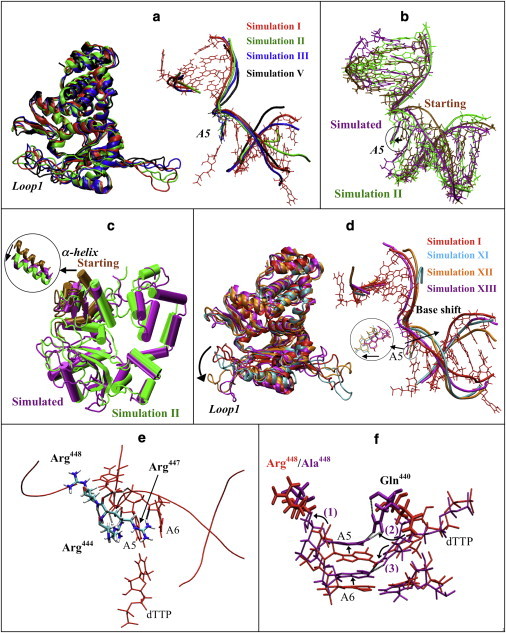
Protein and DNA motions in pol μ simulations. (a) Protein motions (left) and DNA motions (right) of pol μ in selected simulations (red, simulation I; green, simulation II; blue, simulation III; black, simulation V). For clarity, DNA bases other than A5 in simulations II, III, and V are not shown. (b) DNA position in simulation XIV (shifted-DNA model), before (brown) and after simulation (purple), compared with simulation II (green). (c) Protein conformation in simulation XV (open-thumb model), before (brown) and after (purple) simulation, compared with simulation II (green). The motion of α-helix N in the thumb is shown. (d) Protein motions (left) and DNA motions (right) of pol μ in mutant simulations compared with wild-type simulation I (red, simulation I; cyan, simulation XI; orange, simulation XII; purple, simulation XIII). DNA bases other than A5 in simulations XI, XII, and XIII are not shown. The shift of A5 base is indicated. (e) Interactions between DNA and residues Arg444, Arg447, and Arg448. Only residues A5–A6 in the DNA template are shown. Dashed lines indicate hydrogen bonds. (f) The insertion frameshift error observed in simulation XIII (R448A, purple) compared to wild-type simulation I (red). The frameshift behavior can be described in three steps: 1), A5 and A6 rotate/shift toward the downstream side; 2), Gln440 flips to A5; and 3), dTTP shifts toward the upstream side and flips to A6. Nucleotides are drawn with a smaller bond radius. Dashed lines indicate hydrogen bonds.