
Figure 3.
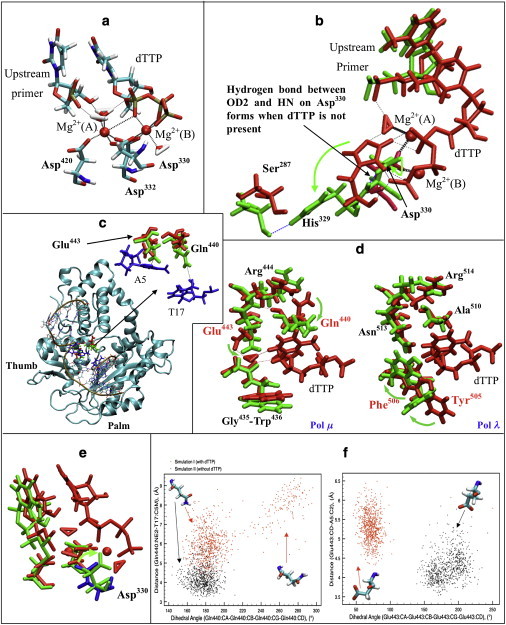
Active-site and dTTP-binding pocket coordination and rearrangement in pol μ. (a) Representative active-site conformation of pol μ from simulation I. Bold dashed lines indicate coordination around Mg2+; thin dashed lines indicate hydrogen bonds between water molecules and the DNA/dTTP. Mg2+(A), catalytic ion; Mg2+(B), nucleotide-binding ion. (b) Comparison of His329-Asp330 in pol μ in simulations I (red, with dTTP) and II (green, without dTTP). Bold dashed lines indicate coordination around Mg2+, black thin dashed lines indicate hydrogen bonds formed in simulation I, and blue thin dashed lines indicate hydrogen bonds formed in simulation II. (c) The location of the dTTP-binding pocket in pol μ (red, Gln440 and Glu443 in simulation I; green, Gln440 and Glu443 in simulation II; blue, A5 and T17 in DNA). Dashed lines indicate the distances used in cluster analysis (Fig. 3f). (d) Comparison of the dTTP-binding pocket of pol μ (left) and pol λ (right). Structures with dTTP are marked red (simulation I of pol μ, and ternary crystal structure of pol λ); structures without dTTP are marked green (simulation II of pol μ, and binary crystal structure of pol λ). Dashed lines indicate hydrogen bonds. The names of residues controlling the accommodating process are shown in red. (e) Comparison of active-site conformation of pol μ in simulations I (red and blue, with dTTP) and II (green, without dTTP). Asp330 in simulation I is marked blue. (f) Cluster analysis of Gln440 (left) and Glu443 (right) in simulations I (red) and II (black) based on dihedral angles (CA-CB-CG-CD) and distances to the DNA (Gln440:NE2-T17:C5M or Glu443:CD-A5:C2).