
Figure 3.
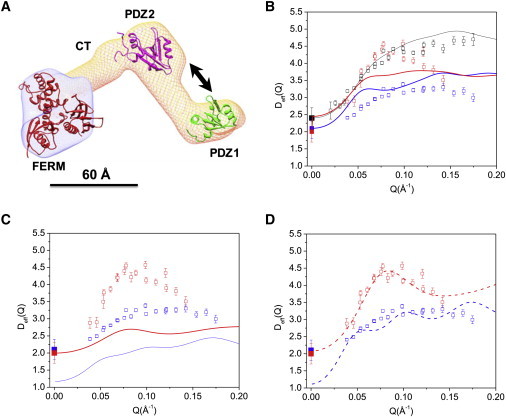
Activation of domain motion in NHERF1 upon binding to FERM domain. (A) The three-dimensional shape of NHERF1·FERM reconstructed from SANS (14) using the software MONSA (30). The structures of PDZ1, PDZ2, and ezrin FERM (PDB code: 1NI2) are docked into the envelope. Arrows represent motions between PDZ1 and PDZ2. A 60 Å scale bar is shown. (B) Comparing experimental Deff(Q) with rigid-body calculations for NHERF1·dFERM (open red squares and solid red line) and NHERF1·hFERM (open blue squares and blue line). Rigid-body calculations used the dummy-atom coordinates from SANS (14). D0 for NHERF1·dFERM (solid red squares) and NHERF1·hFERM (solid blue squares) are from PFG NMR. D0 (solid black squares), Deff(Q) (open black squares), and the rigid-body calculation (solid black line) of NHERF1 are shown. (C) Comparing NSE data with rigid model calculations for the NHERF1·dFERM and NHERF1·hFERM complexes using the coordinates of the docked domains. Symbols same as in panel B. (D) Comparing experimental Deff(Q) with calculations incorporating interdomain motion (via the mobility tensor) between PDZ1 and PDZ2, for NHERF1·dFERM (dashed red line), and NHERF1·hFERM (dashed blue line). Calculations used the docked structures. Symbols for Deff(Q) and D0 same as panels B and C.