
Figure 1.
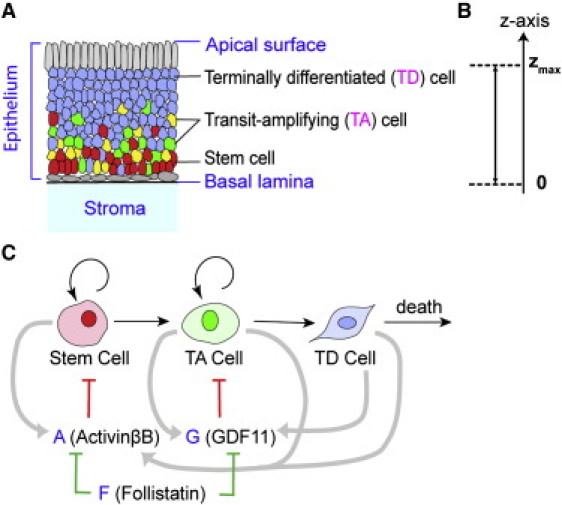
Multistage cell lineage and tissue stratification. (A) A cartoon of general epithelia and relative locations of cells at different lineage stages (red, stem cells; yellow and green, TA cells, blue, TD cells). The connective tissue underlying the basal lamina is stroma. (B) One-dimensional coordinate along the apical-basal axis (z axis). The origin z = 0 is aligned with the basal lamina, and the top of epithelium, which moves due to the growth of the tissue, is denoted by zmax. (C) A schematic diagram of a single cell lineage and associated regulatory molecules. Cells proliferate, differentiate to the next lineage stage or undergo death. The terms A, G, and F represent secreted molecules, which are analogous to molecules ActivinβB, GDF11, and Follistatin in OE, respectively. The secreted molecules A and G inhibit the population of stem and TA cells, respectively (red barred arrow), and they are both inhibited by F (green barred arrow). (Gray arrows) Molecule production: A is produced by all cells, and G is produced by TA and TD cells.