
Fig. 1.
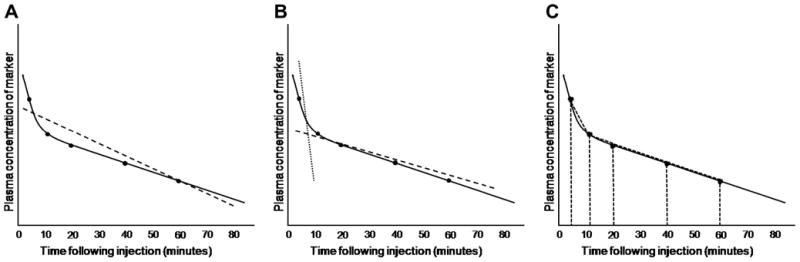
Calculation of GFR is affected by the pharmacokinetic model chosen. In all three graphs, true elimination pharmacokinetics of a hypothetical marker are indicated by the solid black line; measured concentrations of the marker in serum or plasma at various time points are indicated by black dots overlying the black line. A. In a one-compartment model, all time points are used to calculate a single ‘best fit’ line, the slope of which is used to calculate GFR (dashed line). B. In a two-compartment model, initial redistribution of the marker is determined from early time points (dotted line), whereas later time points are used to calculate GFR (dashed line) as for the one-compartment model. C. In non-compartmental models, time points are used to construct trapezoids for estimating the area-under-the-curve.