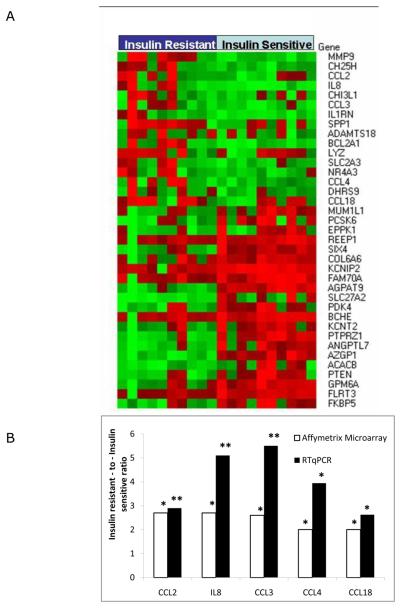
Figure 1.
Expression of inflammation-related genes in omental adipose tissue from insulin resistant and insulin sensitive obese human subjects using microarray and RTqPCR. A. Heatmap representing normalized expression of genes identified by Microarray Computational Environment (MACE) as being significantly increased in omental adipose tissue from insulin resistant subjects and insulin sensitive human subjects. The genes are listed on the right. Expression levels above the mean for the gene are shown in red and expression levels below the mean for the gene are shown in green. B. Fold change in mRNA level of genes in omental adipose tissue of obese, insulin-resistant subjects (n=10) relative to obese, insulin-sensitive subjects (n=10) based on microarray data (white bars) and quantitative real-time analysis (black bars) performed by RTqPCR. ** P < 0.01; * P < 0.05.

