Figure 2.
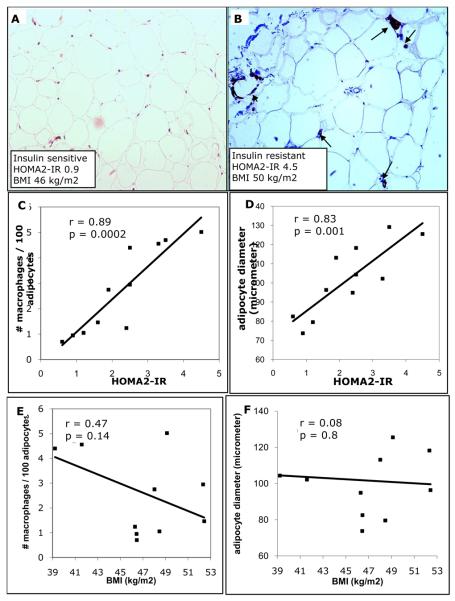
Relationship between macrophage infiltration, adipocyte diameter and HOMA2-IR in omental adipose tissue. Immunohistochemical detection of CD68+ macrophages performed on omental adipose tissue samples obtained from obese human subjects undergoing gastric bypass surgery. A-B. CD68 staining of omental adipose tissue from a representative insulin sensitive (A) and insulin resistant (B) subject. Unlike in adipose tissue from insulin sensitive subject (A) macrophages are observed throughout the tissue (arrows) and arranged in crown-like structures (arrowhead) in the insulin resistant subject (B). Sections taken at 20x magnification. CF, Quantitative analysis of adipocyte diameter and macrophage infiltration in adipose tissue of insulin resistant and insulin sensitive obese human subjects. Adipocyte diameter was calculated from the perimeter measurement of 100 cells. Insulin sensitivity, as determined by HOMA2-IR, correlates with CD68+ macrophage infiltration (C) and adipocyte diameter (D). Body mass index (BMI) shows no correlation with macrophage infiltration (E) or adipocyte diameter (F). Data is an average of 10 histological fields using 10X objective (C or E).

