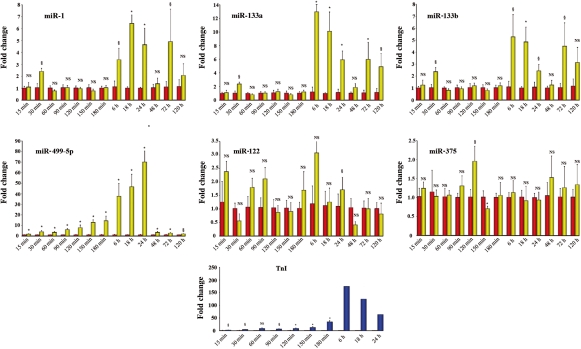
Figure 3.
Time course of microRNAs plasma levels and troponin I in mice with acute myocardial infarction. miR-1, -133a, and -133b achieved their peak either at the 6 or the 18 h time point. In contrast, miR-499-5p achieved its peak 24 h after coronary occlusion. Changes in miR-122 and -375 were minor. It is noteworthy that the magnitude of the increase was highest for miR-499-5p and that this microRNA, 15 min to 6 h after coronary occlusion, closely paralleled the increase in troponin I which was monitored in a separate group of animals. Fold changes were calculated against the mean value of the sham at each time point (for microRNAs, at each time point, n = 4–5 both for myocardial infarction and sham-operated mice; for troponin I, n = 5 at each time point from 15 to 180 min and n = 2 at each time point from 6 to 24 h; results for each microRNA and troponin I are reported as mean ± SEM; NS, not significant; *P < 0.01, §P < 0.05 vs. sham-operated control mice.) Red bars indicate sham controls at each time point, arbitrarily set at 1; yellow bars indicate microRNA values at each time point after myocardial infarction; and blue bars indicate troponin I values after myocardial infarction.

