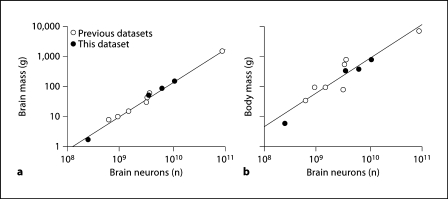
Fig. 8.
Brain mass is better correlated than body mass with total number of brain neurons. Variation in brain mass (a) and body mass (b) are shown plotted against the total number of brain neurons in each species. Filled symbols = present species; unfilled symbols = previous datasets [Herculano-Houzel et al., 2007; Azevedo et al., 2009]. Power laws plotted are brain mass = 7.134 × 10⁻¹⁰ brain neurons1.130 and body mass = 3.088 × 10⁻⁸ brain neurons1.144.

