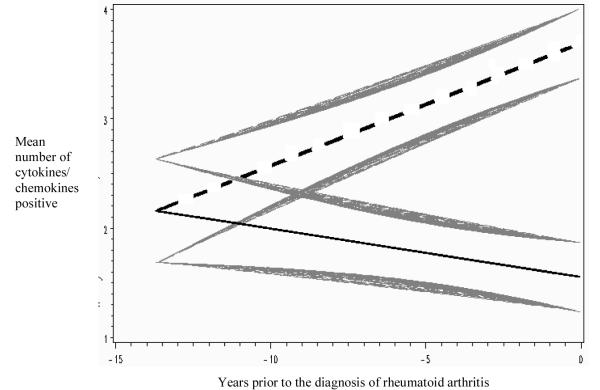
Figure 1. Mixed model regression lines of mean cytokine/chemokine counts in sero-positive rheumatoid arthritis (RA) cases (N=73 with 212 pre-diagnosis samples) versus controls over time in the pre-clinical period of RA development.
The mean values for cases are represented by the straight dashed line, and controls are the straight solid line. The curved shaded lines represent standard errors of the mean for each regression line. In this mixed model analysis RA cases had significantly elevated cytokine/chemokine counts compared to controls ~7.2 years prior-to-diagnosis of RA.

