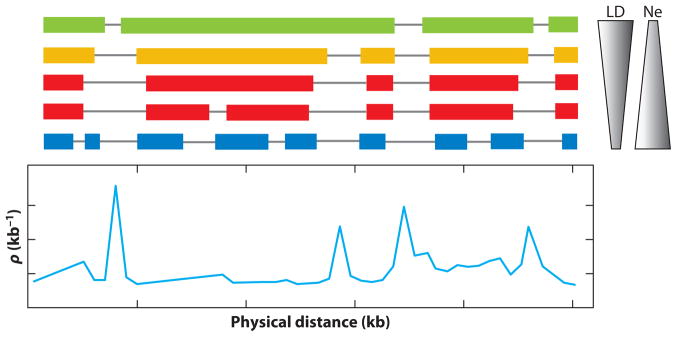
Figure 2.
Relationship between population demography and the linkage disequilibrium (LD) map. Colored boxes indicate the size of recurrently observed haplotypes in the sample. A small population undergoes strong genetic drift, which results in large haplotype blocks, and as the population size increases, these blocks get smaller. We believe that human demography is dominated by an out-of-Africa bottleneck, so that the picture moves from small haplotype blocks in Africa to larger blocks in the out-of-Africa populations due to founder effects and drift. But note that the breaks between the blocks in Africa will often remain breaks outside of Africa, preserving the locations of recombination hotspots. Redrawn from (91). Abbreviations: Ne, effective population size; ρ, the population recombination rate, also written as ρ = 4Neμ, where μ is the mutation rate.

