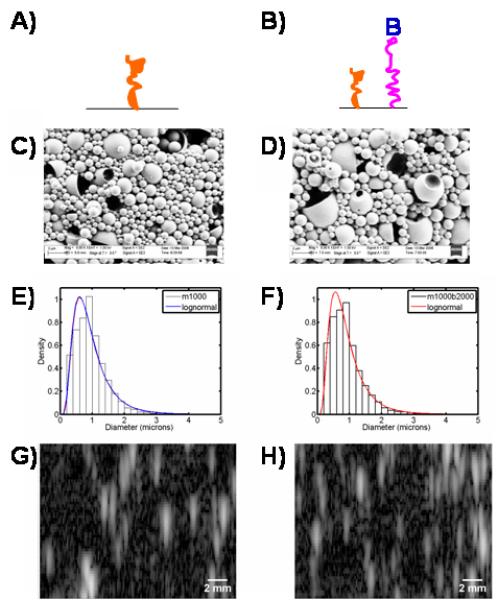
Fig1.

Schematic of surface architecture for m1000 (A) and m1000b2000 (B). Representative FESEM micrographs of the m1000 (C) and m1000b2000 (D) UCAs show a heterogeneous population of spheres (whole and dimpled), and shells. The diameters of the m1000 particles (E) and the m1000b2000 particles (F) are lognormally distributed with a mean diameter of 1.0 ± 0.5 μm and 0.9 ± 0.5 μm respectively. The B-mode images show the echo strength converted to brightness of the m1000 (G) and m1000b2000 (H) UCAs.
