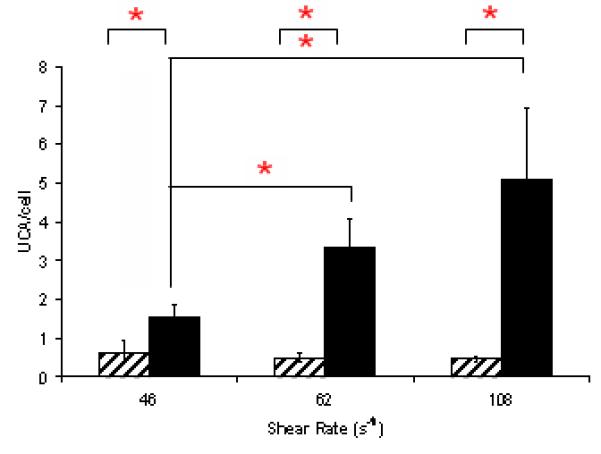
Fig 4.

The bar graph displays the attachment of UCAs to HUVECs as a function of shear rate after 30 min of UCA perfusion. Binding of the RGD-m1000b2000 UCAs increases from 46 s−1 to 62 s−1 and 108 s−1 with shear rate from ~1.5 UCAs/cell to ~5 UCAs/cell. The binding of m1000 (striped) was insignificant (‘*’ indicate significant differences) at all shear rates with less than one UCA/cell.
