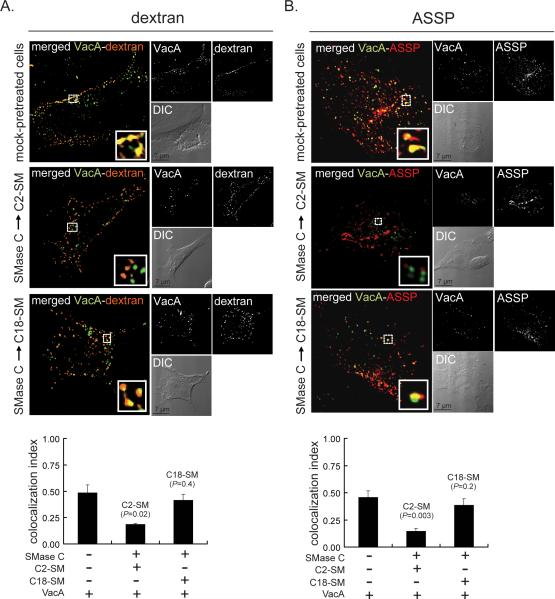
Fig. 4.
Effects of SM acyl chain length on VacA localization with fluid phase- and GPI-anchored proteins-enriched intracellular vesicles.
DIC-fluorescence microscopy images were collected and co-localization of Alexa Fluor 488-labeled VacA with Texas Red-labeled dextran (A) or Alexa Fluor 568-labeled ASSP (B) after internalization for 10 min into AZ-521 cells supplemented with either C2-SM or C18-SM was determined, as described under “Experimental Procedures.” Within the larger merged images of VacA and dextran (A) or ASSP (B), the areas within the dashed white box were enlarged as solid white boxes located in the lower, right hand corners of the merged images, to illustrate VacA (green puncta), dextran or ASSP (red puncta), or VacA co-localized with either dextran or ASSP (yellow-colored puncta). The white puncta in the smaller black and white images illustrate, as labeled, VacA (A, B), dextran (A), or ASSP (B). The smaller, lower panels are the DIC images provided to illustrate the overall shape of the cell(s), and include the black scale bars. The co-localization index was determined for VacA with dextran (A) or VacA with ASSP (B). The results shown were derived from data combined from three independent experiments. Statistical significance was calculated for differences in the colocalization index between those cells enriched in either C2-SM or C18-SM and those cells that had been mock-pretreated only.

