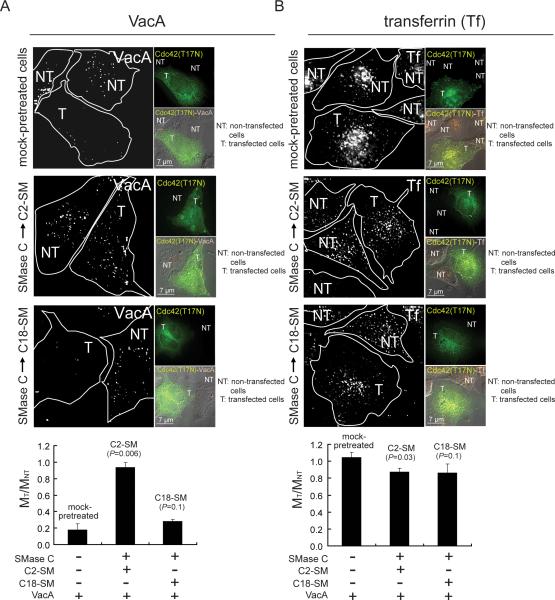
Fig. 5.
Effects of SM acyl chain length on Cdc42-dependent internalization of VacA.
Alexa Fluor 647-labeled VacA (50 nM) (A) or Alexa Fluor 568-labeled Tf (60 nM) (B) was visualized using DIC fluorescence microscopy after internalization for 30 min into AZ-521 cells that had been transfected with pcDNA3-Cdc-42 (T17N)-GFP and then supplemented with either C2-SM or C18-SM, as described under “Experimental Procedures.” The images were rendered to include in each field at least one transfected (T) and non-transfected (NT) cell as indicated, respectively, by the presence or absence of cellular green fluorescence. In the larger images, the boundaries of each cell are outlined in white. The top smaller panels indicate transfected cells, as indicated by the green fluorescence due to pcDNA3-Cdc-42 (T17N)-GFP. The gray scale bars are included in the bottom smaller panels, which show DIC images along with pcDNA3-Cdc-42 (T17N)-GFP (green; A, B) and VacA puncta (red; A) or transferrin (orange, Tf; B). The number of visible fluorescent white puncta were counted within individual cells, and used to calculate MT/MNT, which is the ratio of fluorescent puncta between transfected and untransfected cells. MT/MNT values were derived from data combined from three independent experiments. Statistical significance was calculated for differences in MT/MNT between those cells enriched in either C2-SM or C18-SM, and, those cells that had not been pretreated.

