
Figure 4. INF2 expression.
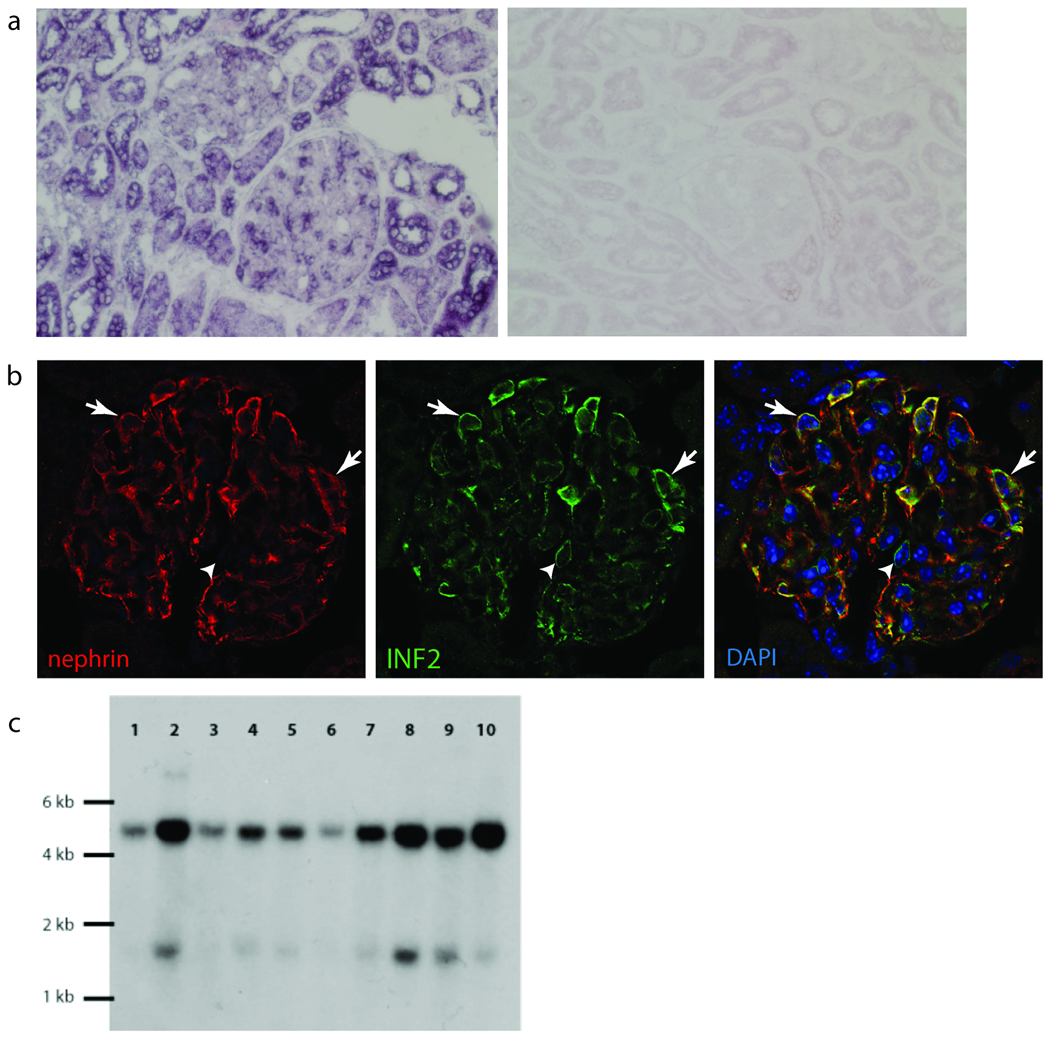
a. RNA in situ hybridization in adult human kidney with digoxigenin-labeled probe targeted against INF2 mRNA, followed by immunohistochemical staining with labeled antibody to digoxigenin. INF2 mRNA expression is apparent in podocytes as well as some tubule cells. Sense control experiment is shown on the right. b. Immunofluoresence staining of mouse kidney with DAPI (blue) and antibodies against nephrin (red) and INF2 (green). INF2 staining is observed in the glomeruli in an epithelial cell pattern. Arrows show areas of nephrin and INF2 colocalization. Arrowhead shows a cell expressing INF2 but not nephrin. d. Northern blot. Gel lanes: 1, Brain; 2, Placenta; 3, Skeletal muscle; 4, Heart; 5, Kidney; 6, Pancreas; 7, Liver; 8, Lung; 9, Spleen; 10, Colon.