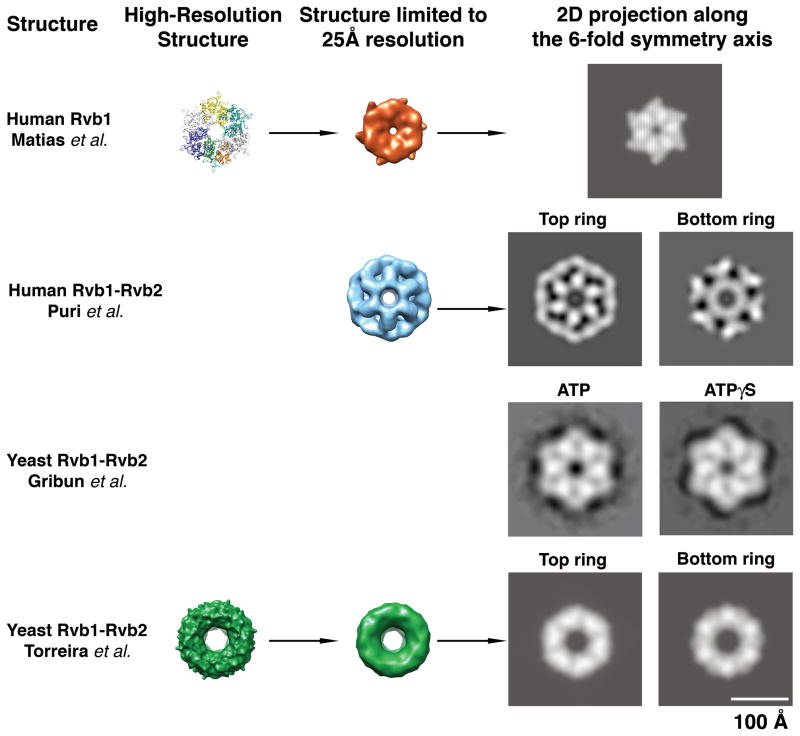
Figure 5. Comparison of the Rvb structures.
To compare the available Rvb structures, high-resolution models such as human Rvb1 and yeast Rvb1/Rvb2 complex were first limited to a resolution of 25Å by applying a Gaussian low-pass filter. A two-dimensional projection along the 6-fold symmetry axis was calculated from the limited resolution 3D structures. In the case of the double-ring EM structure of the human and yeast Rvb1/Rvb2 complexes independent projections were calculated for the top (“Top”) and bottom (“Bottom”) rings (as defined in Fig 2 and 4). The structures are represented at scale thus; their relative size is comparable. In the case of the yeast Rvb1/Rvb2 complex from Gribun et al. (Gribun et al. 2008) the images represent 2D averages of the Rvb1/Rvb2 complex in ATP (left panel) and ATPγS (right panel) obtained upon averaging several hundred 2D projections of these complexes.

