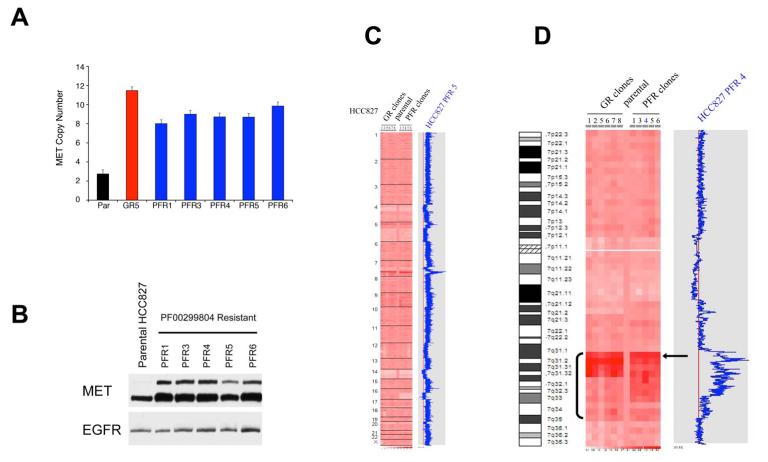
Figure 2. HCC827 PFR cells have a focal amplification in MET that is similar to HCC827 GR cells.
(A) MET copy number determined by quantitative PCR. Parental (Par) HCC827 and MET amplified HCC827 GR (GR5) cells were used as negative and positive controls, respectively. Each column represents the mean ±SD for 3 independent experiments. (B) Parental HCC827 cells and PFR clones were immunoblotted to detect indicated proteins. (C) Genome wide view of copy number changes generated using Human Mapping 250K Sty single nucleotide polymorphism (SNP) array and analyzed using the dChip program (see Experimental Procedures). HCC827 GR clones were compared with HCC827 PFR and HCC827 parental clones. Blue curve indicates degree of amplification of each SNP from 0 (left) to 8 (right). (D) Chromosome 7 view of copy number changes in HCC827 parental, GR and PFR cells. Arrow indicates MET oncogene.

