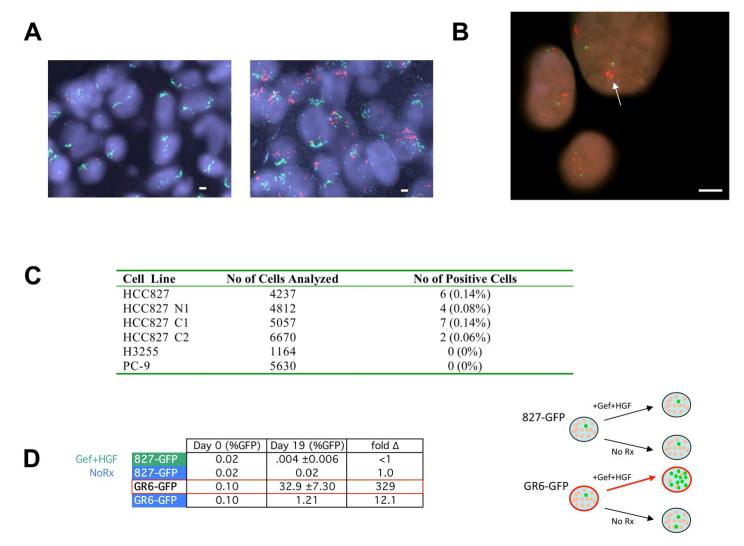
Figure 7. HGF treatment selects out a small pre-existing population of MET amplified HCC827 cells from the parental population in vitro and in vivo.
(A) Fluorescence in situ hybridization (FISH) of MET/EGFR/CEP7 probe set. MET (red) EGFR (green) CEP7 (aqua). Left, tumor sections from control HCC827 xenograft models that do not express HGF showed normal MET copy number. Right, tumor sections from one of three HCC827-HGF xenografts treated with gefitinib (Figure 3E) showed significant MET amplification (arrow). (B) High-throughput FISH analysis of HCC827 cells identifies a subpopulation harboring MET amplification (arrow). MET (RP-11-95I120; red); 7qter (RP-11-6903; green). All scale bars represent 10μm. (C) Parental HCC827 cells and three independent clones harbor a small percentage of MET amplified cells. No pre-existing MET amplification was detected in H3255 or PC-9 cell populations. (D) Left, HCC827 cells were spiked with approximately 0.1% of GFP labeled HCC827 cells or GFP labeled MET amplified HCC827 GR6 cells. Each population was grown in either media alone or media treated with gefitinib (1μM) with HGF (50ng/mL). Cells were collected after 19 days and GFP levels were quantified using FACS. Each data point for cells treated with gefitinib+HGF represents the mean ±SD for 3 independent wells. Fold change is the ratio of Day 19 to Day 0 (%GFP). Right, diagrammatic depiction of results. See also Figure S5.

