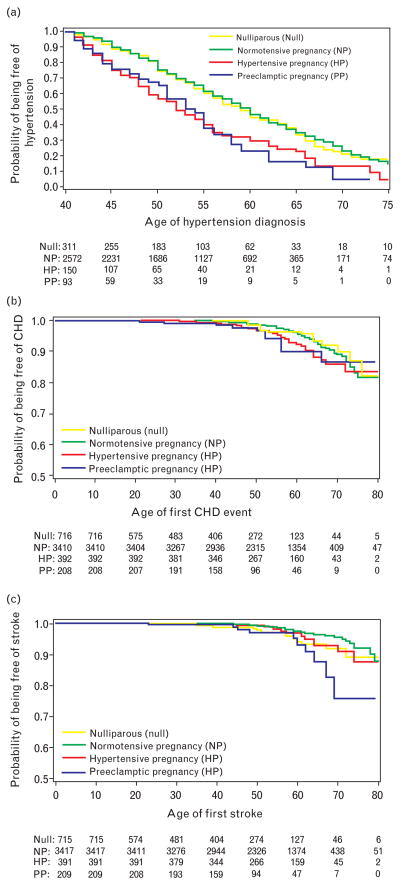
Fig. 1.
Kaplan–Meier plots of the cumulative probability of being free of hypertension (a), coronary heart disease (b), and stroke (c) as a function of age among nulliparous women, those with a history of normotensive pregnancies, and women with a history of either hypertensive or preeclamptic pregnancies. Numbers along the x-axis show the number of women at risk in each age group over time.

