Figure 3.
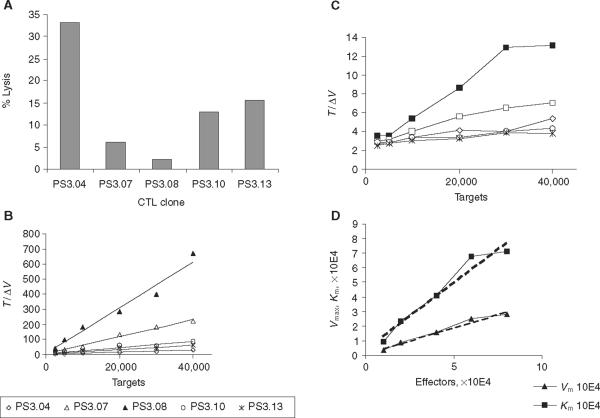
Kinetic analysis of cytotoxic T-cell lymphocyte (CTL) clone activity. Peripheral blood mononuclear cells (PBMCs) transduced with T-cell receptor (TCR) vector and re-cloned by limiting dilution were analysed for lytic activity. Data is presented as (A) standard bulk lytic assay and (B) Hanes plot analysis of kinetic activity. The bulk activity was assayed at 2 h using E : T ratio of 2 : 1. The kinetic activity was analysed as described in Materials and methods and Δv as in Fig. 1. (C) Advanced kinetic analysis from a separate experiment is also presented for clone PS3.04, demonstrating the change that occurs in Vmax and Km as the target cell number is varied at different concentrations of effector cells: ■, 10,000 cells; □, 20,000; ◇, 40,000; ◯, 60,000;  , 80,000. (D) Calculated Vmax and Km plotted against E used to determine the lytic kinetics constants (see Results).

