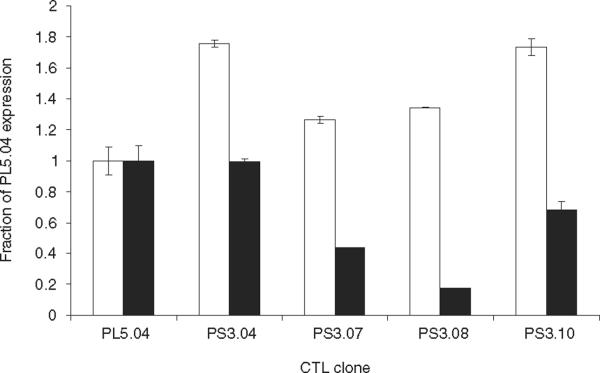
Figure 5.
Expression of T-cell receptor (TCR) transcripts in donor and secondary cytotoxic T-cell lymphocyte (CTL) clones. Real-time polymerase chain reaction (PCR) analysis was used to determine TCR transcript levels by the comparative CT method in secondary CTL clones transduced with SAMEN-PL5.04, relative to the levels expressed in the parental CTL clone, PL5.04. Primers used to detect TCR transcripts were specific for Vβ21 (□) or the constant region of the TCR Vβ chain (■) and beta-actin-specific primers were used as an internal standard (see Materials and methods). Primer specificity was verified by melt-curve analysis and the presence of a single PCR product by agarose gel electrophoresis. The values shown are the calculated average and standard deviation from quadruplicate wells. The data is representative of three experiments.

