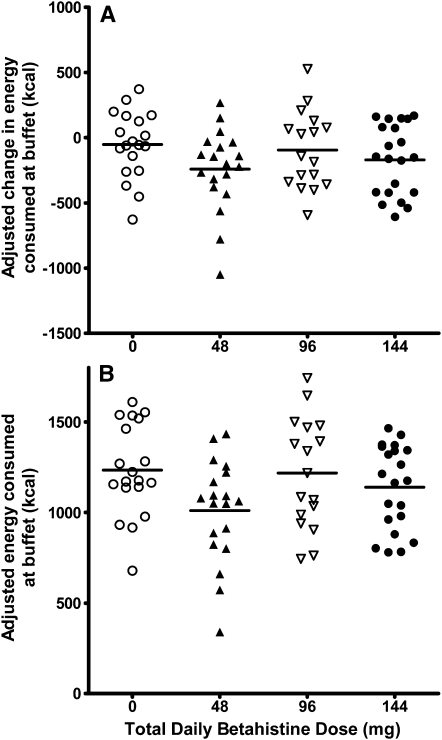
FIGURE 2.
Energy intake during buffet test meal. Change in caloric intake from baseline on the betahistine-treatment day (Δ kcal; A: linear regression model adjusted for age, race, log fat and lean mass, percentage of items disliked from buffet test meal, and percentage of actual relative to predicted total daily energy requirements on the run-in day, with dose as a continuous variable; P = 0.49) and actual caloric intake on the betahistine-treatment day (total buffet kcal; B: linear regression model adjusted for age, race, caloric intake during buffet test meal on the run-in day, log fat and lean mass, percentage of items disliked from buffet test meal, and percentage of actual relative to predicted total daily energy requirements on the run-in day, with dose as a continuous variable; P = 0.76). ○, placebo (n = 19); ▴, 48 mg/d (n = 19); Δ, 96 mg/d (n = 17); •, 144 mg/d (n = 21).

