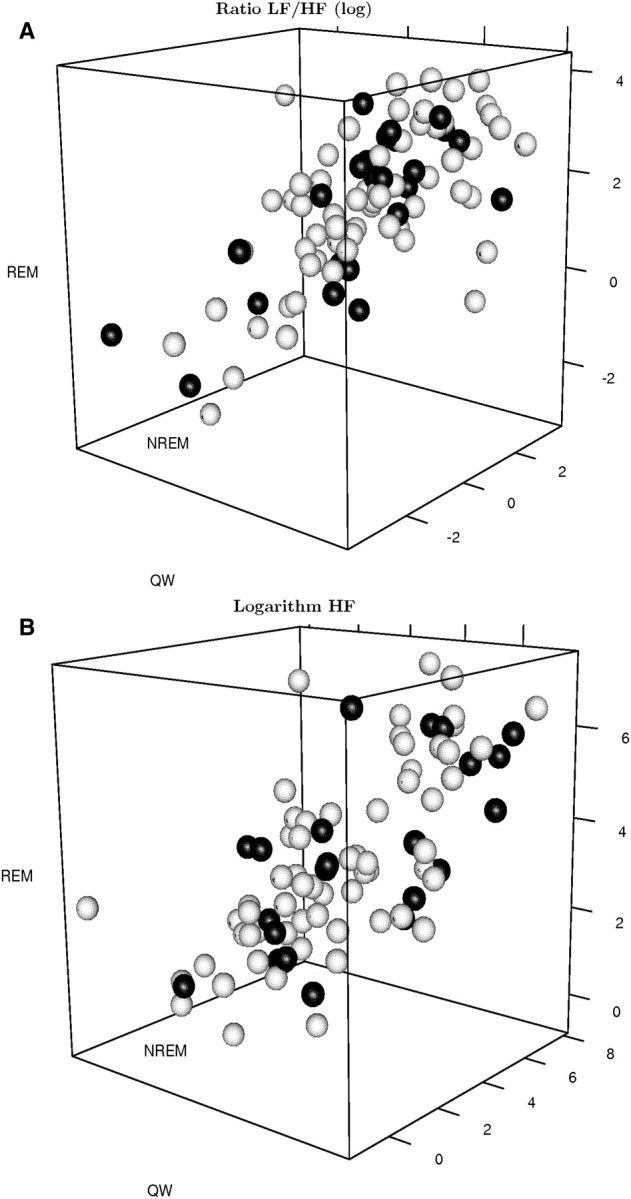
Fig. 1.

A. Three-dimensional scatter plot of the logarithm of the LF/HF ratio of the HRV in wakefulness, NREM and REM sleep stage. Responses of patients with chronic kidney disease are coloured black, while responses of dialysis patients are coloured white. B. Three-dimensional scatter plots of the logarithm of the HF (LNHF) component of the HRV in wakefulness, NREM and REM sleep stage. Responses of patients with chronic kidney disease are coloured black, while responses of dialysis patients are coloured white.
