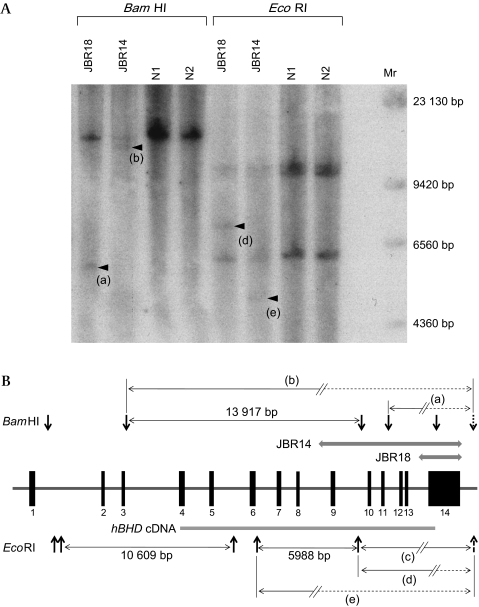
Figure 2.
Southern blot analysis of the FLCN gene. Genomic DNA from two patients (JBR14 and JBR18) and two normal controls (N1 and N2) was digested with either BamHI or EcoRI and Southern blotting was performed using 32P-labelled hBHD cDNA probe25 (panel A). Size marker (Mr) was shown on the right. Distribution of 14 exons of the FLCN gene, restriction sites of BamHI and EcoRI, and expected length of fragment are schematically presented (panel B). The location of an undetermined restriction site which is involved in the generation of an aberrant band is indicated by a dotted arrow. Aberrant bands (a, b, c, d, and e) expected to be generated with a large genomic deletion (a thick shaded line) in JBR14 and JBR18 are depicted with the addition of a dotted line.

