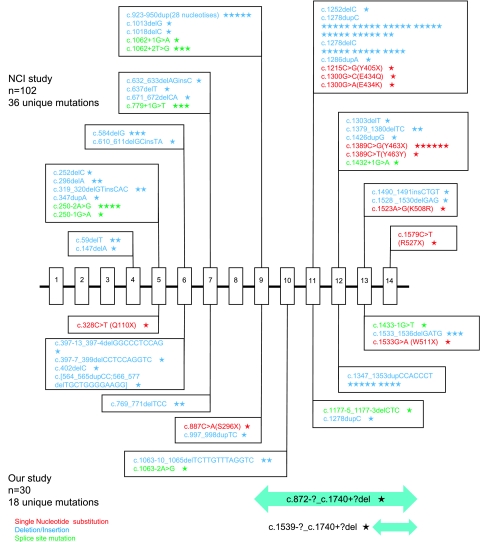
Figure 3.
Comparison of FLCN germline mutation spectrum reported by the National Cancer Institute (NCI) group and the current study group. The upper half shows the result of NCI group19 20 while the lower half is the result of the current study (combined with the previously reported result10 and the present study). Symbols: red, single nucleotide substitution; blue, deletion and/or insertion; green, splice site mutation; the bars on the bottom, genomic deletion; a star, one patient.

