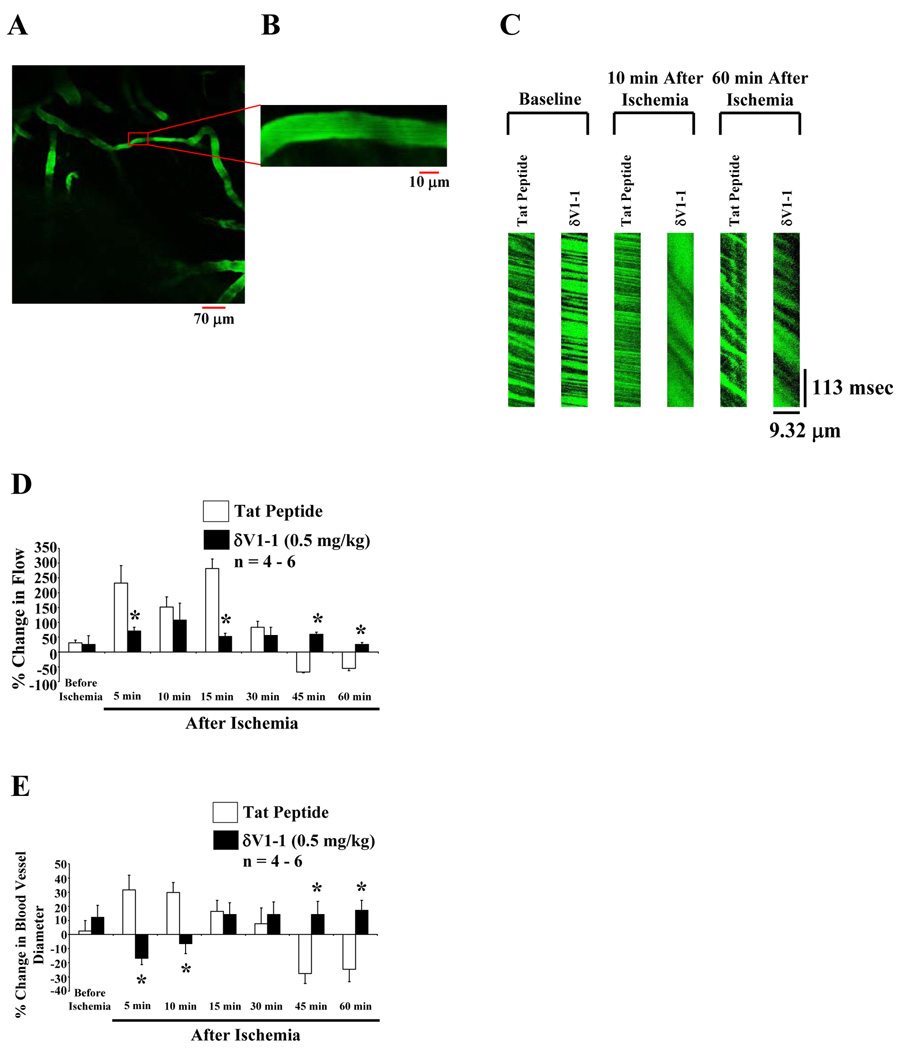
Figure 1.
In vivo imaging of cerebral blood vessels using 2-photon microscopy. Rats were injected with fluorescein isothiocyanate (FITC)-dextran (0.2 mg/kg) shown in green (A and B). Images were captured at 20 X (A) and 200 X (B) of a particular cortical blood vessel. Blood flow measurement using linescans of single vessels (linescans at 512 Hz were used to determine RBC flow) (C). RBC flow values were calculated based on the slope of the shadows (measured using NIH Image J) produced by RBCs when traversed through the blood vessel. The slope of each shadow was calculated, averaged, and expressed as percent change in flow over time before and up to 60 min after ischemia (via 2-VO) pretreated with δV1-1 or tat peptide (vehicle) (D). Rats pretreated (30 min) with δV1-1 induced attenuation of hyperemia resulting in a decrease in CBF 5 and 15 min after 2-VO, while attenuating hypoperfusion by enhancing CBF 45 and 60 min after ischemia. Cerebral microvessel diameters are measured by capturing images similar to Figure 1B (E). Rats pretreated (30 min) with δV1-1 reversed post-ischemic hyperemia and hypoperfusion suggesting vasoconstriction (decreased blood vessel diameter, 5 and 10 min after ischemia.) followed by vasodilation (increased blood vessel diameter, 45 and 60 min after ischemia) of cortical microvessels (n = 4 – 6). * indicates p ≤ 0.05 as compared to tat peptide at the respective time point.

