
Table 1.
Optimization of Amination Conditionsa
| ||||||
|---|---|---|---|---|---|---|
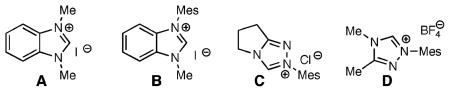 | ||||||
| entry | catalyst | R1 | R2 | yield (%)b | ||
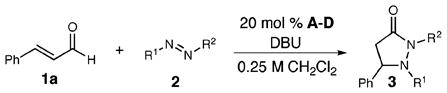
| 1 | A, B, C, or D | CO2Et | CO2Et (2a) | 0 | ||
| 2 | A | Ph | Ph (2b) | 26 | ||
| 3 | B | Ph | Ph (2b) | 29 | ||
| 4 | C | Ph | Ph (2b) | 18 | ||
| 5 | D | Ph | Ph (2b) | 28 | ||
| 6 | C | Ph | SO2Ph (2c) | 16 | ||
| 7 | D | Ph | SO2Ph (2c) | 16 | ||
| 8 | A or B | Ph | COPh (2d) | 0 | ||
| 9 | C | Ph | COPh (2d) | 42 | ||
| 10 | D | Ph | COPh (2d) | 49 | ||
| 11c | D | Ph | COPh (2d) | 63 | ||
| 12d | D | Ph | COPh (2d) | 54 | ||
a
20 mol % DBU and 3 equiv of 2, 23 °C.
b
Isolated yields.
c
30 mol % DBU, 3 equiv of 2, and 4 Å molecular sieves, 0 °C.
d
30 mol % DBU, 2 equiv of 2, and 4 Å molecular sieves, 0 °C.