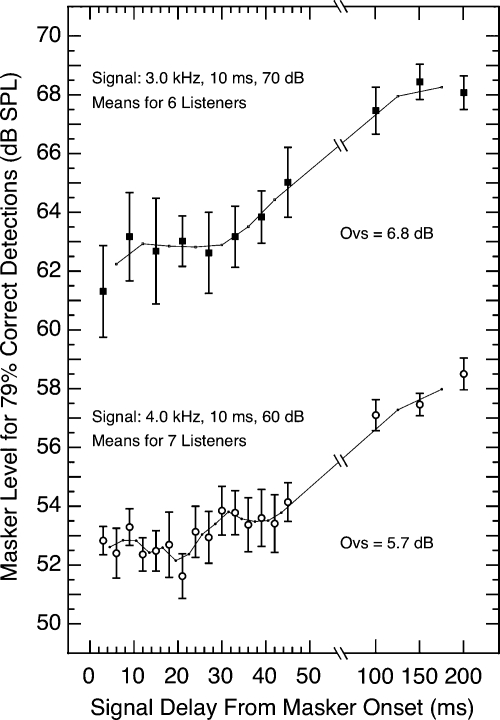
Figure 1.
Overall level of the masker needed for constant detectability of the 10-ms tonal signal as a function of the delay in the signal’s onset following the onset of the wideband masking noise (400 ms in duration). The data at the top are for a 3.0-kHz signal of 70 dB SPL; the data at the bottom are for a 4.0-kHz signal of 60 dB SPL. Each point is a mean of six (top) or seven (bottom) subjects; five subjects were common to the two sets of data; the flags indicate standard errors of the mean; and the short line segments illustrate the running average across successive pairs of delay values. For clarity, the abscissa spacing is different for the two ranges of values of signal delay. “Ovs” designates the difference between the 200- and 3-ms means (the overshoot). The corresponding data for individual subjects are shown in Figs. 23. The data for subject NN were excluded from both the 3.0- and 4.0-kHz plots because he showed minimal overshoot.

