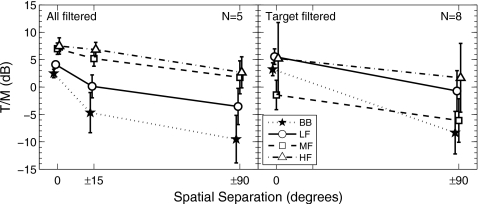
Figure 1.
The results from Experiment 1 expressed as target-to-masker ratio (T∕M) in dB. The data are group means and associated standard deviations for the target-masker spatial separations that were tested. The left panel shows the results when target and maskers were filtered equally. The right panel shows the results when the maskers were broadband and only the target was filtered. In both panels, the data for different frequency regions are indicated by the different symbols. The data points are offset slightly along the abscissa and connected by lines for clarity of presentation.

