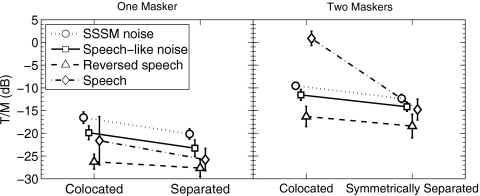
Figure 3.
The results of Experiment 2 plotted as T∕M at threshold for one masker (left panel) and for two maskers (right panel) of the same type. The spatial configurations are indicated along the abscissa. The individual functions with different symbols in each panel represent the type of masker (see legend). The data points are offset and connected only for clarity of presentation.

