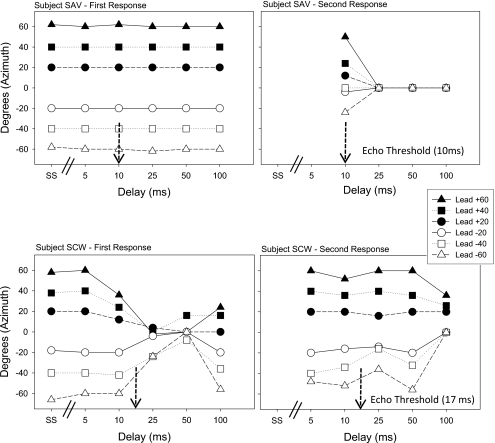
Figure 3.
“First Response” (left) and “Second Response” (right) data are shown for two adult listeners (SAV on the top and SCW on the bottom), as a function of condition∕delay (SS, 5, 10, 25, 50, 100 ms). Each panel includes data from the 6 lead- location conditions (see symbols and legend), ranging from −60° to+60°. Data are averaged across all trials for that listener∕condition (error bars are not shown). Within the lower panels, the listeners’ echo thresholds are indicated by an arrow pointing to the approximate delay corresponding to echo threshold.

