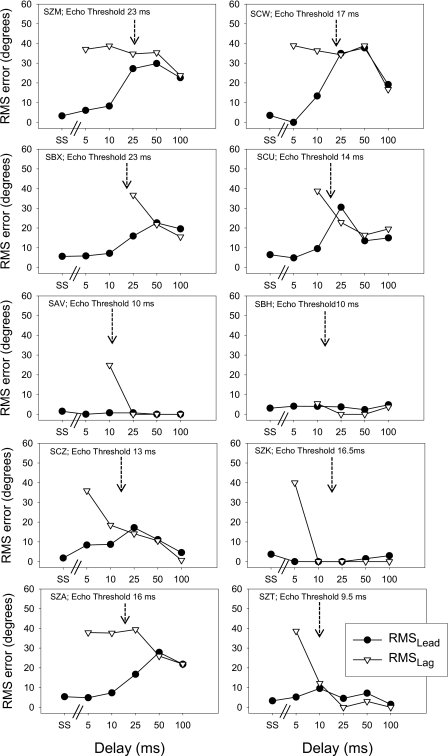
Figure 5.
Localization errors were collapsed across all lead locations, and are shown for each listener in a separate panel. Root-mean-square (RMS) values were computed using Eq. 1 (see text). RMSlead (filled symbols) indicates the average errors of the First Response relative to the location of the lead. Results are plotted as a function of stimulus condition beginning with SS for single source and all the precedence delays (5, 10, 25, 50 and 100 ms). RMSlagdata (open symbols) indicate the average errors for the Second Response relative to the location of the lag. Within each panel, listener codes are given, along with the listener’s echo threshold (see arrow).

