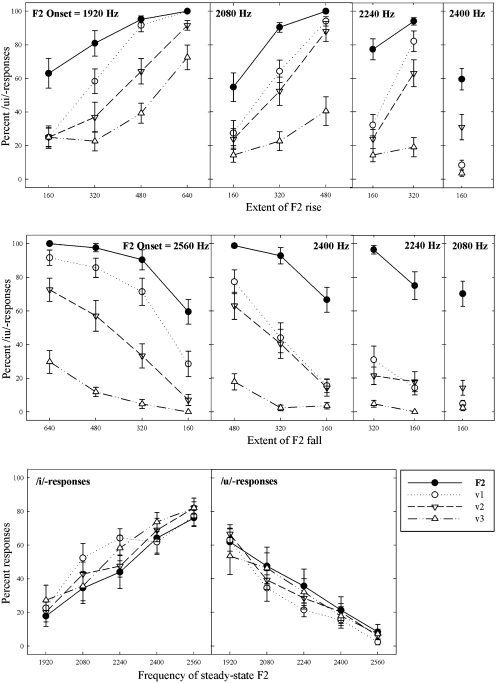
Figure 2.
Classifications of rising F2 glides as ∕ui∕ (top panels), falling F2 glides as ∕ui∕ (middle panels) and steady-state tokens as ∕i∕ and ∕u∕ (bottom panels). Shown are mean responses (with standard errors) to actual F2 series (F2) and to three virtual F2 series in which frequency separation between the two sine wave pairs differed (V1=2.9 bark, V2=3.9 bark, and V3=4.95 bark). The panels display separately the responses for each actual and virtual F2 onset for the rising∕falling glide and for frequency of steady-state F2.

