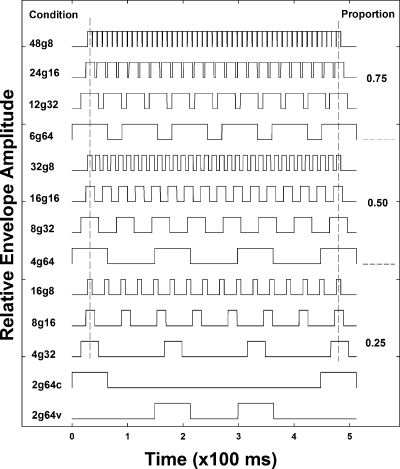
Figure 1.
Schematic illustration of the 13 stimulus conditions. The y-axis is the relative envelope amplitude and the x-axis is time in 100 ms scale, with a total duration of 512 ms. The 13 stimulus conditions are labeled on the left and the three total speech proportions are labeled on the right. The two vertical dashed lines correspond to the “anchor points” around which the first and last on-duration of the speech waveform was centered, respectively, for all stimulus conditions except 2g64c and 2g64v (stimulus conditions were labeled in “interruption rate-g-on duration” format).

