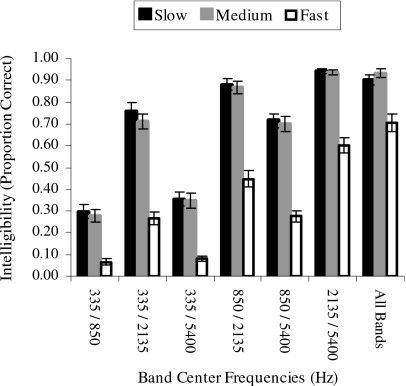
Figure 7.
Results from the control study preceding Experiment 2. Intelligibility (proportion of words correctly identified) is plotted as a function of distortion condition (six two-band conditions, one four-band composite condition). Black bars denote performance for slow-rate sentences, gray bars for medium-rate sentences, and white bars for fast-rate sentences. Error bars depict standard error of the mean. Middle-frequency bands (850-∕2135-Hz CF) and low- and high-frequency bands (335-∕5400-Hz CF) were paired respectively for use in Experiment 2.

