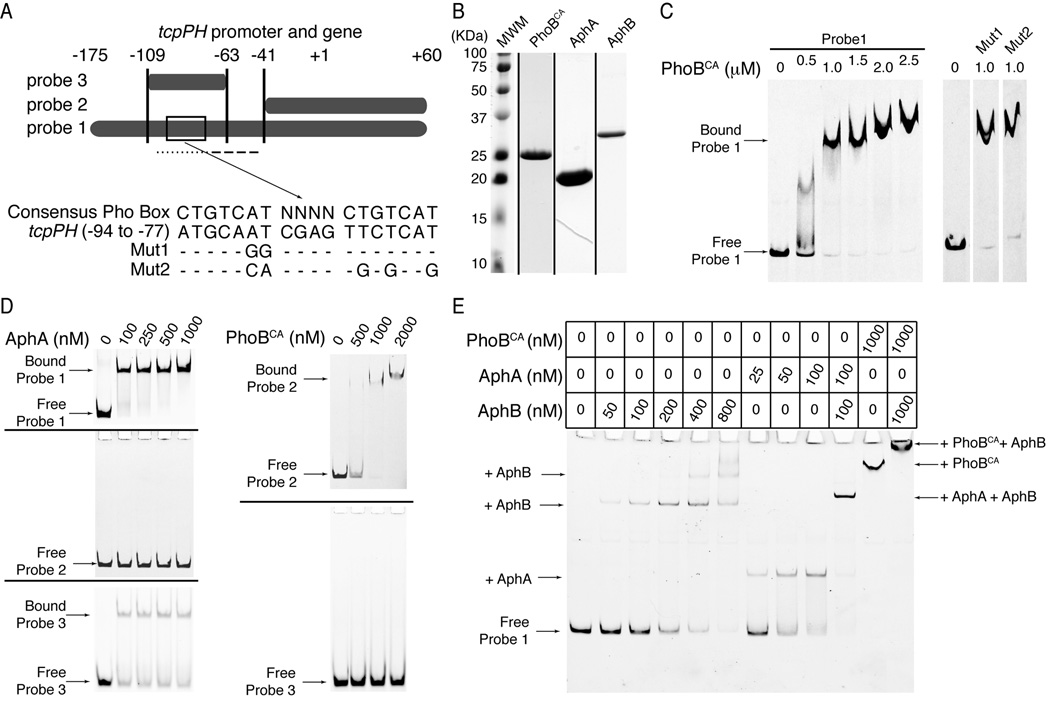
Figure 4.
PhoB binds to the tcpPH promoter. A) Illustration of the DNA sequences used as probes for protein binding in the gel mobility shift assays in C-E. The boxed area in probe 1 is region −94 to −77 of the tcpPH promoter. Its sequence is shown below it, aligned to the consensus Pho Box sequence. Mut1 and Mut2 show mutations made within this putative tcpPH promoter Pho Box. The dotted line below probe 1 represents the binding site for AphA, whereas the dashed line represents the binding site for AphB.. B) Coomassie stained SDS-PAGE gels for PhoBCA, AphA and AphB. Each lane is from a different gel, representing the peak fraction of the gel filtration run of each protein. C-E) Gel mobility shift assays for binding of PhoBCA, AphA and AphB to the tcpPH promoter region. Zero denotes that no protein was added to the reaction mix. C) On the left: electro-mobility of 6FAM-labeled probe 1 in the presence of increasing concentrations (0.5 to 2.5 µM) of PhoBCA. On the right: electro-mobility of 6FAM-labeled Mut1 and Mut2 of probe 1 in the presence of 1 µM PhoBCA. The free wild type, Mut1 and Mut2 of probe 1 have the same mobility (not shown). The lanes are non-contiguous on the same gel. D) On the left: electro-mobility of 6FAM-labeled probe 1 (upper gel), probe 2 (middle gel) or probe 3 (lower gel) in the presence of increasing concentrations (100 to 1000 nM) of AphA. On the right: electro-mobility of 6FAM-labeled probe 2 (upper gel) or probe 3 (lower gel) in the presence of increasing concentrations (500 to 2000 nM) of PhoBCA. E) Electro-mobility of 6FAM-labeled probe 1 in the presence of PhoBCA, and/or AphA and/or AphB at the concentrations indicated in the table above the gel. The arrows in C-E) indicate the migration level of the complexes formed by the DNA probes and the proteins they are bound to.

