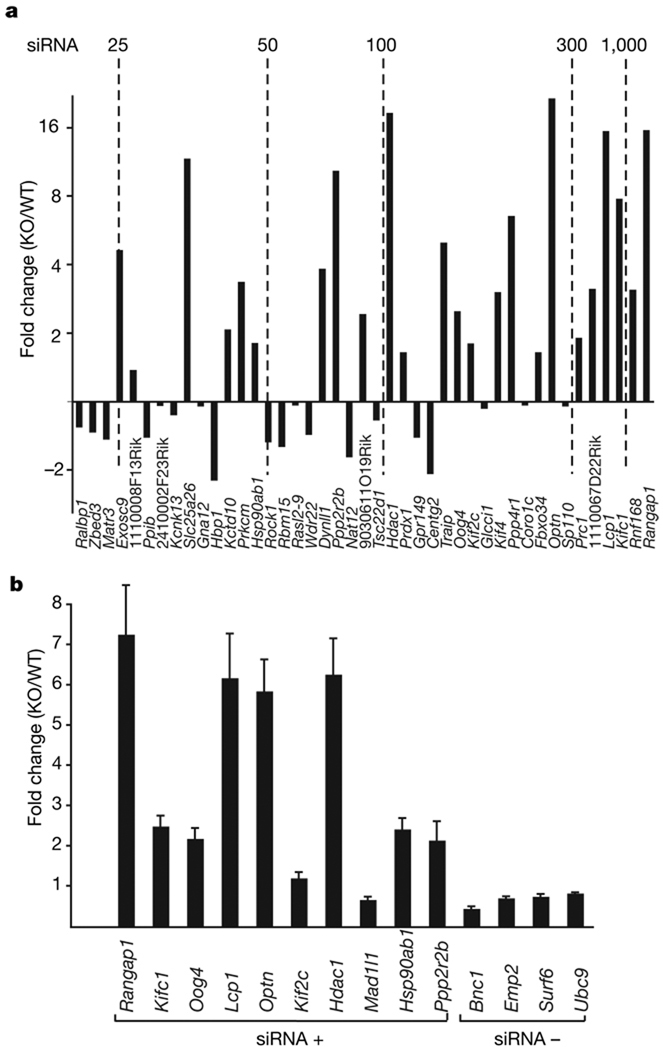
Figure 3. Endo-siRNAs have a role in gene regulation.
a, We had previously compared expression levels in wild-type and Dicer-null oocytes by microarray14. Genes with a large number of siRNAs were examined. For those with significant changes in expression (P < 0.1), the fold change in Dicer-null (KO) versus wild type (WT) was plotted. The graph was arranged according to the number of antisense siRNAs per gene in our data set, increasing from left to right (with benchmarks shown). The identity of the gene represented by each bar is given below. b, Fourteen genes (with and without siRNAs in our data set, indicated by siRNA+ and siRNA−, respectively), comprising a set in which some showed significant changes and some did not, were tested for changes in mRNA levels in Dicer-null versus wild-type oocytes by quantitative PCR. Gene names are indicated below each bar; error bars represent the mean ± s.e.m. (three replicates).

