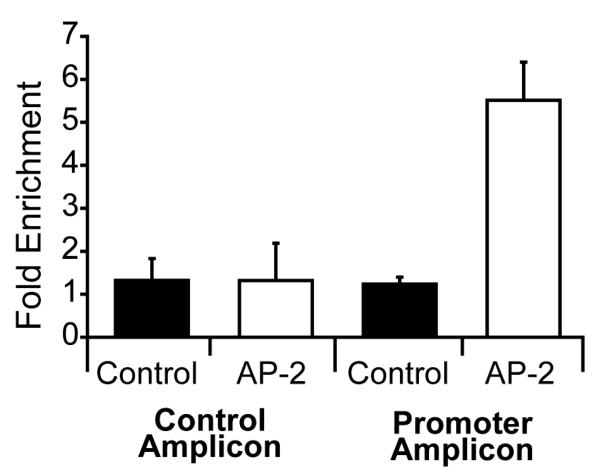
Figure 4.
AP-2-2α protein binds in vivo to sequences in regulatory regions of the APP gene ChIP results were analyzed for the ChIP control region (control amplicon) and promoter region (promoter amplicon). The control region was void of AP-2 binding sites. Fold enrichment of AP-2 associated DNA (AP-2) was measured for each amplicon and compared to total cellular input for each group (control). Fold enrichment of AP-2 for the control region showed no statistically significant difference compared to the total cellular input while AP-2 enrichment was approximately 4.5 fold (p<0.05) in the promoter amplicon compared to total cellular input.

