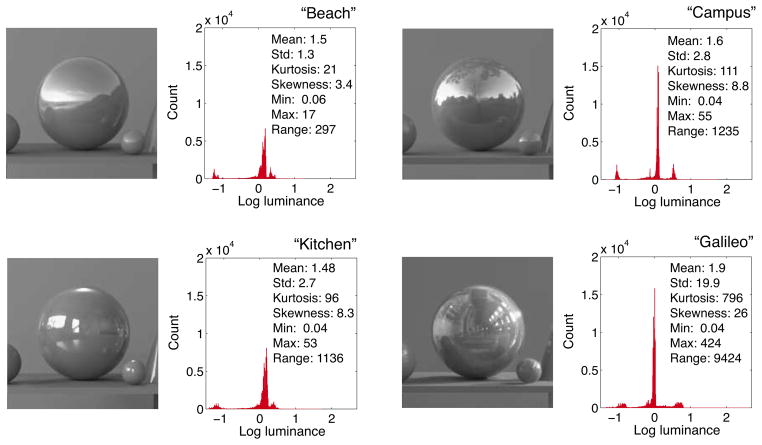
Figure 3.
The left hand images in each panel show a cutout of a scene rendered under the four different light fields used in this study. The histograms on the right from the images show the distribution of log luminances across the sphere. The insets list basic linear luminance statistics of the spheres.

